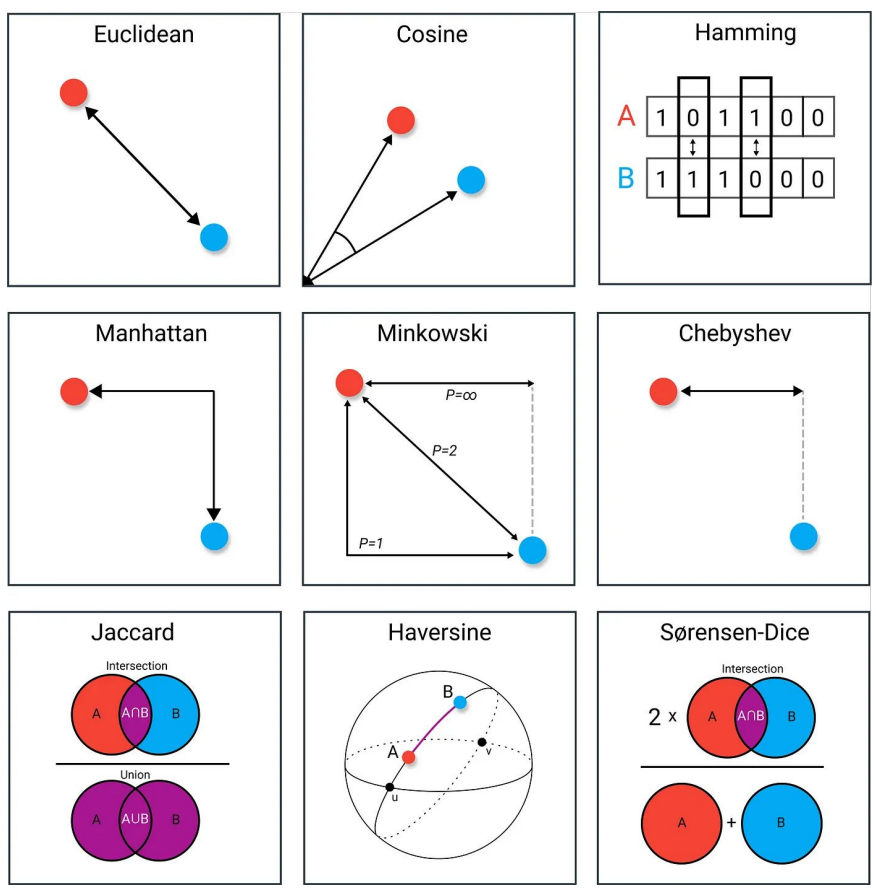
a good metric if we want to ignore differences at scale
Manhattan distance
also known as L1-norm, a sum of distances along every axis
dManhattan(x,y)=∑i=1n∣xi−yi∣
Jaccard similarity
proportion of feature values shared between two instances divided by the total number of instances
ignores the importance of the absence of the feature ()
J(A,B)=∣A∪B∣∣A∩B∣=∣A∣+∣B∣−∣A∩B∣∣A∩B∣
Jaccard distance = 1−J(A,B)
Edit distances
Hamming distance
it measures the number of substitutions in features to get from instance A to instance B
Levenshtein distance
similar to Hamming distance, but allows more operations (substitute, insert, delete)
mainly for the similarity of strings
kNN
= k-nearest neighbors
uses similarity functions to find k nearest neighbors to a given instance, used for:
classifying, predicting scores and for regression
it’s decision heavily depends on the choice of k
if k=N (all instances), then kNN is a majority classifier
the importance of choosing the optimal k can be reduced by incorporating the weights of the present instances (weighted by distance)
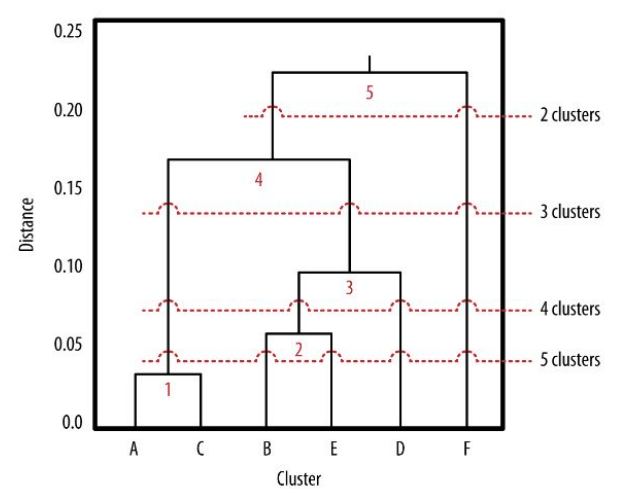
Agglomerative/hierarchical clustering
a different way to cluster data points
it works from bottom-up, at the beginning, each data point is in it’s own cluster (distance = 0)
as the distance is bigger and bigger, let’s merge the closest data points to respective clusters
we can finish when we have only one cluster or whenever we like
the resulted dendogram shows us the structure of distances between individual data points and how are they clustered together
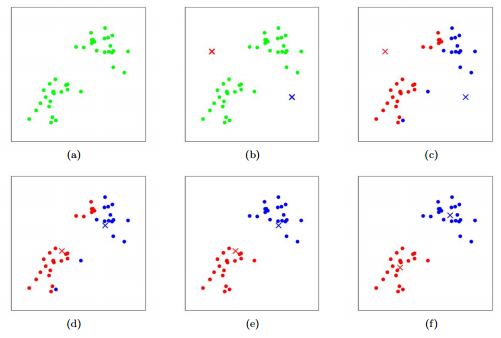
k-Means clustering
a different approach to clustering
the process:
randomly select k cluster centroids (temporary central points for clustering)
repeat:
assing each instance to the nearest cluster centroid (using the distance metric)
recompute the centroid location (so it’s closer/more in the center to all connected instances)
stop, when the process converges (there are minimal changes in the squared error) or there are no further reassignments of instances
advantages:
it’s more efficient than hierarchical clustering (that needs to calculate distances between each pair of points, k-Means only the distance between instances and centroids)
disadvantages:
can use only Euclidean distance, hierarchical can use all kinds of distances