= a set of techniques to answer research questions with quantiative data
typical procedure:
come up with a model, theory and hypothesis
develop or select concrete measurement instruments
collect data
analyse data (e.g. statistical modelling)
evaluate results
Variables and confounders
in the models and theories, we use constructs (those are general terms, like “business” or “IT alignment”)
variables are operationalized versions of constructs (so they have values and can be measured)
we have:
dependent variables (outcomes)
independent variables
confounders - a variable that is related to both the dependent and independent variable (at least partially)
why to notice them?
because if we don’t take them into account, we can think that there is a relationship between A and B (but there is a confounder C driving/influencing them both)
e.g. “IT investments” (independent) → “company performance”
the confounder is the company’s size (because different sizes of companies have different IT investments, different scenarios, and different performance drivers)
we can control them by using control variables
control variables
a) keeping the confounder constant in the study (e.g. study only companies of the same/similar size)
b) measure them and include them in the statistical model (e.g. add the company size as variable to the regression - this way I can isolate the effect of IT investment on company’s performance after accounting for the company size)
= testing the hypothesis over all possible values of the confounder
mediator variables
mediator variables “sit” in between independent variable and dependent variable (A influences the mediator and the mediator influence the B)
there are two types of mediation:
full mediation
e.g. IT governance → business/IT alignment → business value from IT
the relationship between IT governance and business value from IT drops to zero (“everything goes through the mediator”)
partial mediation
there are two types of relationship: direct and undirect (through the mediator)
so the mediator does not affect everything, but is partially involved
moderator variables
they act as catalyzators, the change the strength and increase/decrease the strength of the relationship between independent and dependent variables
e.g. the IT savvyiness of the board members increases the relationship strength between “board involvement in IT governance” and “business value from IT”
conditional process modelling = a combination of influences of mediators and moderators on the relationship between variables
variable types:
categorical variables (nominal, ordinal)
binary vs. polytomous (more than two categories)
useful is frequency analysis (e.g. how many subjects in each category)
quantitative variables
on the level of interval and ratio measurement levels
a lot of statistical analyses can be performed
Quality criteria
reliability
if we find consistent results if we replicate the study
validity
if the conclusions based on the study are true
a) construct validity = the methods are really measuring and manipulating the properties that we intend them to, this is a prerequisite for internal and external validity
b) internal validity = to observed effect is actually due to the hypothesized cause
what we meant that will cause X to happen, was actually caused by X
the risk here are confounders (they may affect the variables, so X happens as well, but not because of what we meant will cause it)
c) external validity = the hypothesized relationship also holds in other settings (e.g. other groups, industries, times etc.)
Measurement
what is operationalization?
choosing/creating a concrete method to measure a construct
variables are operationalized versions of construct
there are different operationalizations (some of them are capturing the whole construct, some of them are capturing only some aspects)
levels of measurements:
nominal: differentiate between values (male/female, right-handed/left-handed)
ordinal: differentiate and order (levels of education, levels of agreement from strongly disagree to strongly agree)
interval: differentiate between values, ordering and interpreting differences (e.g. temperature)
ratio - the highest level of measurement
it has a meaningful zero point (zero means “none of this thing exist”)
e.g. 0 °C does not mean that temperature does not exist, it cannot be relatively compared to different temperatures, and the relational ratios change when converting to Fahrenheit
but 0 cm means no length at all, in every unit system
meaninful zero also means we can do relative ratios (10 cm is twice as much as 20 cm, which holds in every unit system)
according to the reached level of measurement, we can choose a correct statistical tool to get interesting insights
measurement reliability and validity:
validity = the choosen instrument is measuring the construct we intended to measure
influenced by systematic error, if the systematic error is high, we are measuring the wrong construct
we have to have reliable measurement in order to assess the validity (necessary, but not sufficient condition)
reliability = how reliable is the measurement?
if we replicate the measurement in the same conditions we should get consistent, stable and same/similar results
influenced by random error, if the random error is high, we are measuring imprecisely
Surveys and questionnaires
difference:
survey: a list of questions covering a variety of topics
questionnaire: focuses on one construct or a related set of constructs
rules:
provide clear instructions
administered by the interviewer
one construct should be measured by more questions (to enable reliability/internal consistency)
avoid complicated questions and double negations, extreme wording
response options should be exhaustive (each respondent should be able to position himself) and mutually exclusive (they won’t overlap)
we sample population (taking a subset of units/elements from the whole set)
stratum = a subset of the population, where elements share some characteristic
sampling frame = an actual subset of the population to choose from
population = all IT experts
sampling frame = the results of the LinkedIn search and my network
types of sampling:
probability sampling:
for each element in the population, the probability of the element ending up in the sample in known and non-zero
a) simple random sampling (each element has an equal and independent chance to be in the sample)
b) systematic sampling (only first element is taken by random and then the rest is predetermined, like skipping X elements etc.)
the sample could be biased if there is some pattern in the sampling frame
c) stratified random sampling (divide population into mutually exclusive strata and then do simple random sampling from each strata)
non-probability sampling:
some elements have zero probability of being selected or their probability is unknown (we cannot claim a representative sample)
a) convenience sampling (selected elements are easy to get, e.g. in the case study)
b) snowball sampling (small group is selected, then they are asked to get other participants)
e.g. Delphi study and focus groups
c) purposive sampling - elements are chosen based on the judgement of the researcher
for very specific case researches
Statistical tests
correlation tests (Pearson, Spearman) - tests a relationship between variables (correlation does not mean causation)
regression analysis - test of the relationship between independent variables and one dependent variable
e.g. if the IT investment predicts the company’s performance
tests of mean differences:
Independent samples t-test (difference between two groups on single, continuous dependent variable)
H0 = means of the group are equal
e.g. measuring differences between companies adopting COBIT or not on their performance
Independent samples z-test (difference between two groups on a single proportion)
H0 = proportions (percentages) are equal
ANOVA (difference between more than two groups on a single, continuous variable)
test if all means are equal (H0)
the idea is not to run multiple t-tests, but run the on all groups simultaneously
if the test is significant, it also finds where the differences are (some post-hoc tests are used to find out)
ANCOVA (extension of ANOVA which controls the effect of covariates on the dependent variable)
it just handles the confounders statistically
tests of repeated measures (“longitudinal research”):
paired samples t-test (difference for one group between two time-points)
e.g. a company before adopting COBIT and after
repeated measures ANOVA (difference for one group between more than two time-points)
mixed ANOVA
when sample is divided into two or more independent groups and we are measuring differences in more than two time-points
e.g. measure business/IT alignment before, during, and after COBIT 5 adoption in small and large organizations
Latent constructs/models
variables like age are directly measured, variables like happiness and indirectly inferred through observed variables
factor analysis = look how observed variables cluster under latent dimensions
exploratory factor analysis (exploring the underlying factor structure and try to explain it theoretically)
e.g. “I like people”, “I don’t mind presenting”, “I am often in the center of attention” will cluster in a cluster, which we could label “extraversion”
I can run survey without strong theoretical basis and to see, which clusters show
confirmatory factor analysis (formally testing the hypothesis of a specific factor structure)
we can test test variable “extraversion” with the new dataset
it takes the clusters from the exploratory factor analysis and tests them as hypothesis against a new dataset to see, if the data patterns actually fit
structural equation modelling (regression with latent variables)
we can assess the effect of extraversion on hapiness (measuring causal relationships between latent constructs)
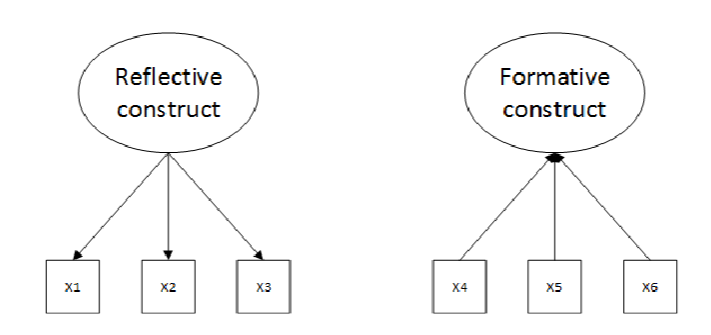
two types:
reflective latent constructs
the hypothesis is that the reflective latent construct influences/causes changes in all the indicators
formative latent constructs
the hypothesis is that the all the indicators represent some part of the formative latent construct (their changes cause changes in to latent construct)